

Are we able to understand large amounts of information more easily with comprehensive images?
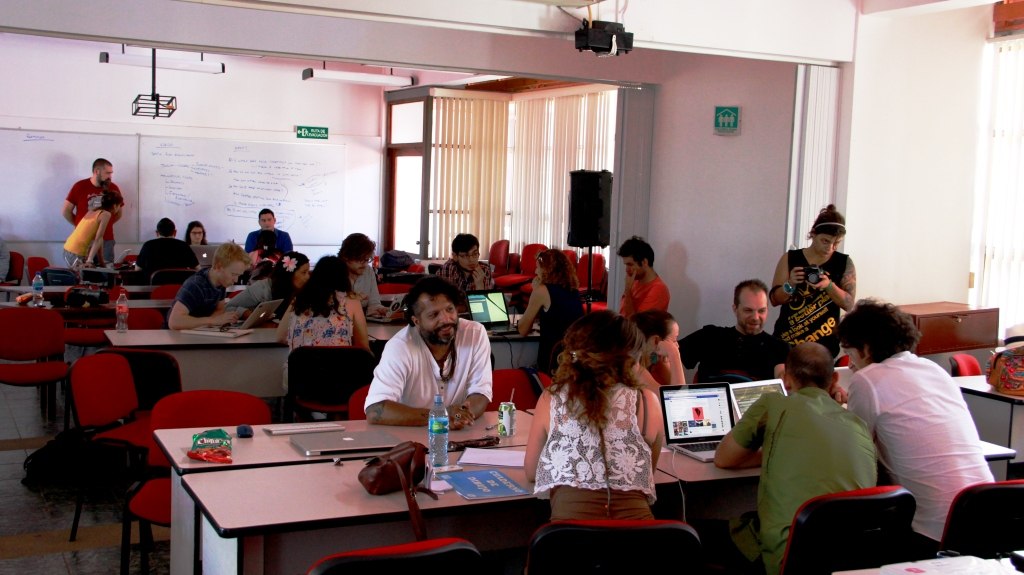
On December 11th, international journalists, developers, and designers gathered at the Universidad National Costa Rica in Nicoya for a conference on Data Visualization sponsored by TheVoice of Guanacaste. The workshop was led by Portuguese journalist and Knight Fellow Mariana Santos and co-created by VOG Publisher John Johnson.
The three-day workshop kicked off with a dynamic presentation from La Nacion’s leading data expert Giannina Segnini on Costa Rica’s water. It did not go unnoticed that we were addressing this issue in Guanacaste, one of the hardest-hit drought provinces in the country. Santos explains, “We wanted to use the expertise of others to tell this story, which is very serious and create awareness.”
After an interactive exposition of data access and organizationfrom Segnini and her team, we were split into three groups with equal mixes of our different professions. Our task as journalists was how to derive a story from analyzing data and how to present it in an engaging, visual manner.
The developers spearheaded the arrangement of information that we used to compare and cross-reference facts in order to generate a narrative. Once the data was organized, we were able to see patterns, speculate scenarios and hypothesize probabilities.
My group decided to take a look at the country’s supply and demand of water and using the data available to us, speculate why some areas of Guanacaste had plenty of water and others none.
From our data comparisons, we had a story, but needed an impacting medium for all that information to reach our readers. In agreement with the old adage, “a picture is worth a thousand words”, we created an interactive map of the region in which readers can click on an area and read the associated statistics. We listedhow much water was available, who the provider was, where the water was sourced from, and how much is used per person and household. We taken pages and pages of numbers and turned it into something a three-year-old can understand.
Guest speaker Chris Cross, an interactive developer with The Guardian notes, “Data journalism [in Costa Rica] is still so young. I’m genuinely delighted that this project, which is about clean water and water supply, has the potential to be enormously useful to the whole population.”It was clear that by knowing what technological tools were available, it was possible to create a significant story for readers to connect with in an engaging, interactive way.
With the high prevalence of smart phones and our digitalized ingestion of news as a modern culture, data visualization allows journalists to impart a lot of information in an efficient and resounding fashion.
Most of us are busy all day with limited time to check the news, which is why infographs, tables and other visual representations of data are so vital to the modern digital newsroom. We have more access to more information than ever before with less time to distribute and ingest. Therefore, it’s essential to impart that information in avisually powerful way using advanced technological tools.
Attendee Roberto Rodriguez, President of 3Vot, which builds apps for businesses, expressed that, “It’s about changing the approach so that the solution is better.”Additionally, because of social media, readers are inundated with new information all day long so distinguishing the aesthetic of how a story is presentedand the time it takes to understand it makes all of the difference.
As a group, we experienced how our map transcended the data and research into an immediate connection with the reader in a vibrantway. By using charts, hyperlinks, infographs and other visual platforms, the news is given a face or aesthetic to associate with. It imparts complicated and technical data in a universal way thus reaching a larger demographic.
Santos says, “I think today more than ever journalists have the power and responsibility to do their work in order to change the social environment. So, whatever I can do to empower them and by gathering experts together we can share the power, which is knowledge.”
Our story started out as dense reports and spreadsheets, but evolved into a colorful interactive map that told an important story with just a few clicks. Comprehensive? Yes. Powerful? Absolutely.


Comments