

What is your reaction to learning that people in Nosara and Samara pay five to six times more in property taxes than in the rest of the canton? Did you know that 23% of workers in Nosara don’t have medical insurance? And for all the hype about education in Costa Rica, teenagers in Nosara only have a 24% likelihood of graduating from high school. These are just some of the findings revealed by an in-depth study performed by the Center for Responsible Travel (CREST).
During the upcoming months, The Voice of Guanacaste will publish a series of articles based on the newly-released investigative report, “A Portrait of Economic Realities in Nosara and Sámara: Providing Tools for Sustainable Development.” The report was commissioned by the Nosara Civic Association (NCA) and funded by the Johnson Short Foundation Harmony Fund.
The report includes data on taxes, levels of education, poverty, unemployment and other social indexes to help community leaders identify strengths and needs for future community development. The report is available both in English and Spanish on the NCA website, http://www.nosaracivicassociation.com, and will be discussed during a meeting of the Nosara Integral Development Association (ADIN) and the NCA.
Marcos Avila, ADIN president, commented that the report has valuable information that supports the desire to form a District Council and is “very important because the community itself finds out about what happens in the municipality.”
The idea of forming a District Council is even more attractive since the Legislative Assembly passed the District Council Reform Act in February, giving more administrative autonomy to these councils, of which there are currently eight in Costa Rica.
Likewise, the NCA president, Alvin Rosenbaum, remarked, “The report provides the necessary data to better target private sector support of social services and amble evidence that a District Council form of government is needed to keep Nosara tax collections in Nosara.”
He noted that he was particularly surprised by the imbalance between property taxes paid by Nosara compared to the number of projects received back in the district, a ratio of nearly 5 to 1, which was worse than he expected. Projects are approved by the Municipal Council.
The data gathered did not include taxes collected for permits, fines and licenses because the municipal reporting system does not code them by district. Furthermore, the canton does not document the lack of services such as trash collection.
“Nicoya’s mayor, through his cooperation in providing this data, was acknowledging for the first time the lack of services and projects provided to the Nosara District and his apparent lack of opposition for the development of a District Council form of government for Nosara,” Rosenbaum concluded.
Challenges and Surprises While Making the CREST Report
An Interview with Janelle Wilkins
The Voice interviewed Jannelle Wilkins, the CREST Consultant who took the lead in gathering data for the report. Wilkins has lived in Monteverde for the past six years, where she worked as the executive director of the Monteverde Institute and helped establish the Monteverde Community Fund, based on the concept of travelers’ philanthropy, with support and technical assistance from CREST.
To create a comprehensive study, looking at the overall picture that includes indicators of poverty, economics, growth and development, Wilkins first met with members of the NCA and ADIN to clarify their expectations and needs and find out what data they already had available. “One of ADIN’s biggest contributions was opening the doors to the Municipality in Nicoya. They had paved the way through various meetings with the mayor so that when I arrived there, I was met with a completely open door policy,” Wilkins related.
She noted that Adrian Rojas Herrera of the municipal planning office and Iraida Solorzano Obando and Carmen Sigdy Jimenez Juarez in the municipal controller’s office were especially helpful. “They bent over backwards to get me the information that I requested. The problem is that many times they do no record the information in a way that was easy to access.”
One of the biggest challenges was that data by district was limited and hard to find. For example, the municipality could provide property tax information for 2013 by district, but all previous years’ data was lumped together in a cumulative total. Fortunately, one of the members of NCA had requested similar information in 2008, making it possible to compare those two years, but no others.
“Also it was very difficult to find the information about expenditures by District. But here the Canton office did their best to provide me with the information they could,” Wilkins related. “They printed out from their records all of the projects which had been budgeted, implemented or not, since 2009. These were not broken out by District, however, so another office, the engineers, went through each year and manually wrote the District which corresponded to each project. It was a valiant effort. I spent many hours compiling and analyzing this data as it was of great interest to NCA and ADIN.”
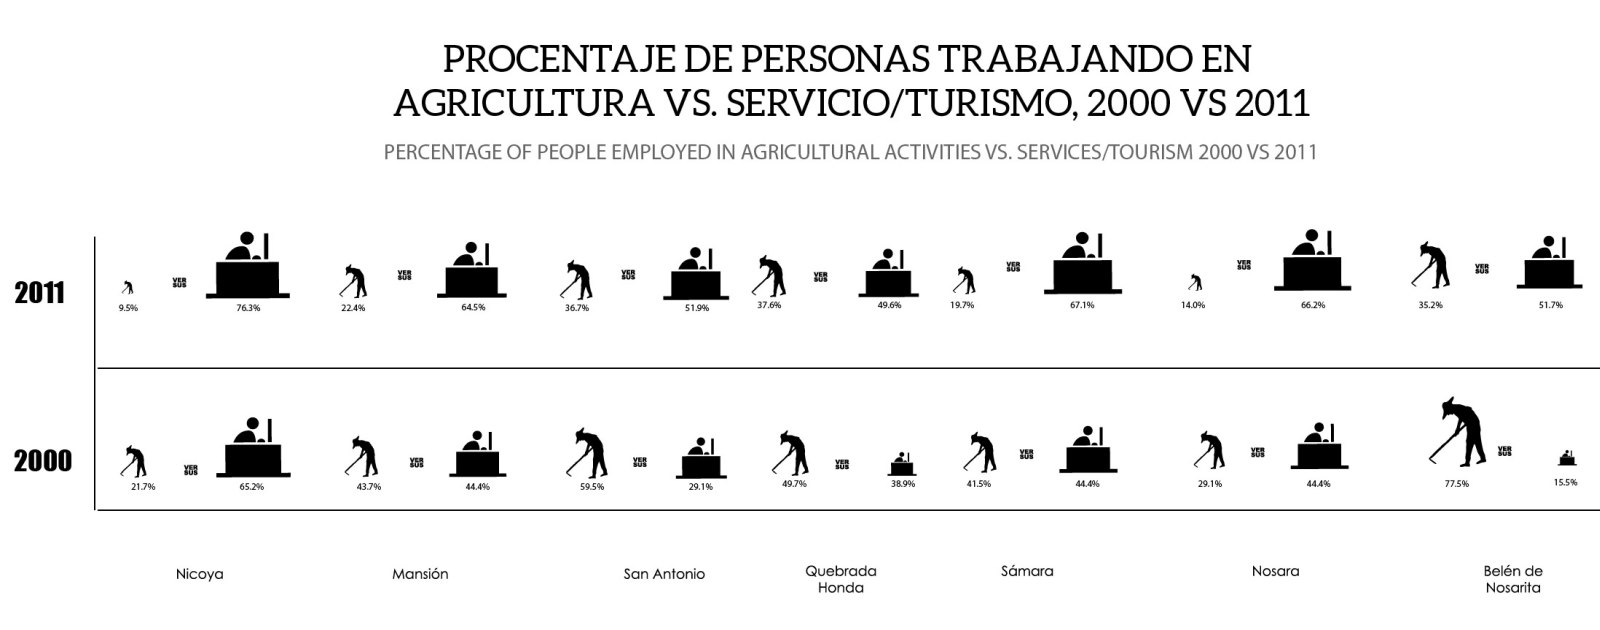
In addition, a lot of available data was based on the 2000 census, which is not very recent. Although information from the more recent 2011 census is available online, analysis and breakdowns of this data is still limited.
Among some of the surprises discovered in the course of the investigation, Wilkins noted the disparity in health insurance access. In 2012, in the District of Nicoya, 12.5% of workers were not covered by the National Health Insurance compared to 23% in the District of Nosara.
She also noted that indicators such as poverty levels and unemployment show that tourism is not the “end all” solution for the region, as most studies show that Guanacaste has some of the greatest need despite its high level of tourism.
The disparity between the income generated in Nosara and Samara in comparison with the amount reinvested in these districts by the municipality was another important theme of the study. “It wasn’t a surprise. People in Nosara and probably in Samara knew that they were paying more in taxes than other areas. I think they knew that they weren’t getting much back in terms of projects and services. I think however the huge difference that we saw when we got down to the data was more than expected,” she remarked.
The amount paid in taxes per property naturally differs from one district to another since agricultural land is taxed differently than luxury properties, which is not necessarily a bad thing, she commented. However, she pointed out that Costa Rica does not have a nationwide system for assessing and regulating property values, and most tax amounts are based on self-evaluations.
The number of projects approved and budgeted per district versus the number of projects actually executed was another striking disparity. Wilkins noted that a thorough audit would have to be performed to fully understand the issue due to the way the accounting is done, bouncing or carrying over budgets from year to year, as well as to determine if the projects were budgeted based on actual municipal income versus projected income.
“I think through the process of requesting the report and interviewing the people involved, there became a greater acknowledgement of the need to work together to make change,” Wilkins commented. She noted that collaboration will be key to addressing the problems highlighted by the report.
Key Findings and Points of Interest
POVERTY: Today some 22% to 25% of Costa Ricans live in poverty. In the districts of Nosara and Sámara, it is estimated that 25% or more of Costa Rican families live in poverty.
EXTREME POVERTY: “Extreme poverty” based on the ability to cover basic food needs fell from 9% in 2001 to just over 5% in 2006 in the Canton of Nicoya, a marked improvement over surrounding cantons. The Canton of Santa Cruz had the region’s highest concentration of poor, with 11.5% of people living in Extreme Poverty.
BASIC NEEDS: The four categories of basic needs are: adequate shelter, healthy lifestyle, access to knowledge, and access to other essential goods and services. In 2011, Nosara and Sámara registered between 34% to 48% of households lacking in at least one basic need and Belén de Nosarita registered between 49% to 63% on this same scale, according to the Estado de la Nacion (State of the Nation). These numbers represent an improvement over 2001 but are still well above the national average of UBN of 24.6% of households.
INEQUALITY: The United Nations Development Program (UNDP) has ranked Costa Rica as 100th out of 126 countries worldwide on its Income Inequality Index, giving it an unenviable position among the world’s most unequal countries. By 2010, incomes for the richest 10% of Costa Rican households were 24 times greater than the poorest 10% – marking the highest level of inequality in the last 20 years.
HEALTH INSURANCE: In 2012, in the District of Nicoya, 12.5% of workers were not covered by the National Health Insurance compared to 23% in the District of Nosara.
EDUCATION: In 2011, only 46.3 percent of students between 17 and 21 completed secondary education nationwide. The district of Nicoya is close to the national average with 43.3% of students completing high school, but in the rural districts this number is often far less. In Nosara District, for example, only 25.4% of students graduated from high school.
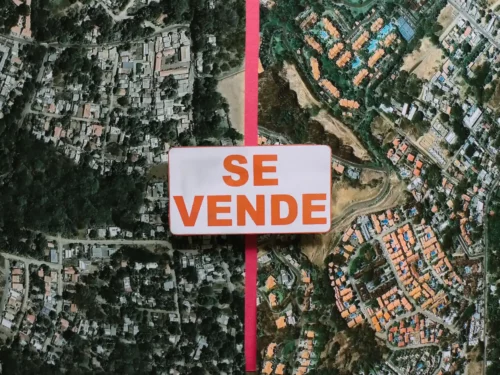
PROPERTY TAXES: Each person in Nosara and Sámara pays almost 5 to 6 times more in property taxes than individuals living in the more densely populated areas of Nicoya and between 7 to 9.5 times more than people in the other four districts.
PROJECTS PER DISTRICT: Between 2009 and 2012, Nicoya District had 149 projects proposed, San Antonio had 146 projects proposed, and Belen de Nosarita had 112, while Nosara had 67 and Sámara had 50. In Nosara, most of the 67 budgeted projects were for road maintenance or improvements to drainage systems between 2009 and 2012. Only about 15 were for other projects such as schools and community and health centers, and of these, only 5 were executed.

Comments